Software and Systems How-To's, Tutorials, Demos, Notes
Using Istio Service Mesh, Prometheus and Grafana, and Kiali for Microservices on OpenShift

In this post, we are going to take a look at how to use Istio, Prometheus and Grafana on OpenShift to manage and monitor your microservices.
We assume we have the following:
- An openshift 3.11 cluster (an all-in-one VM is fine)
- A cluster-admin account
- Ansible installed (version 2.6.15 and higher)
- Siege installed https://www.tecmint.com/load-testing-web-servers-with-siege-benchmarking-tool/
Install Istio on OpenShift
First, we download istio from here. As of this writing, the version of istio is already 1.1.3, however, our setup was created when version 1.1.1 was available. Extract the file somewhere, and cd to the directory install/kubernetes/ansible/. Run the playbook:
ansible-playbook main.yml
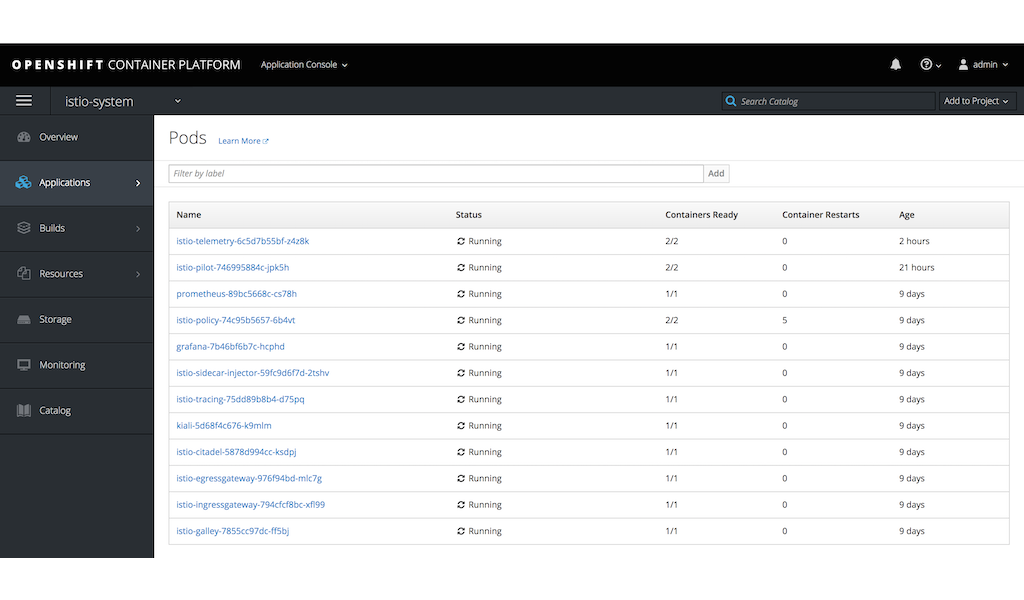
After the run, go to the OpenShift console and look for the istio-sytem project. Wait for all the pods to run. If you see some pods failing, delete the pod so it will re-deploy.
Accessing the Grafana and Kiali UI
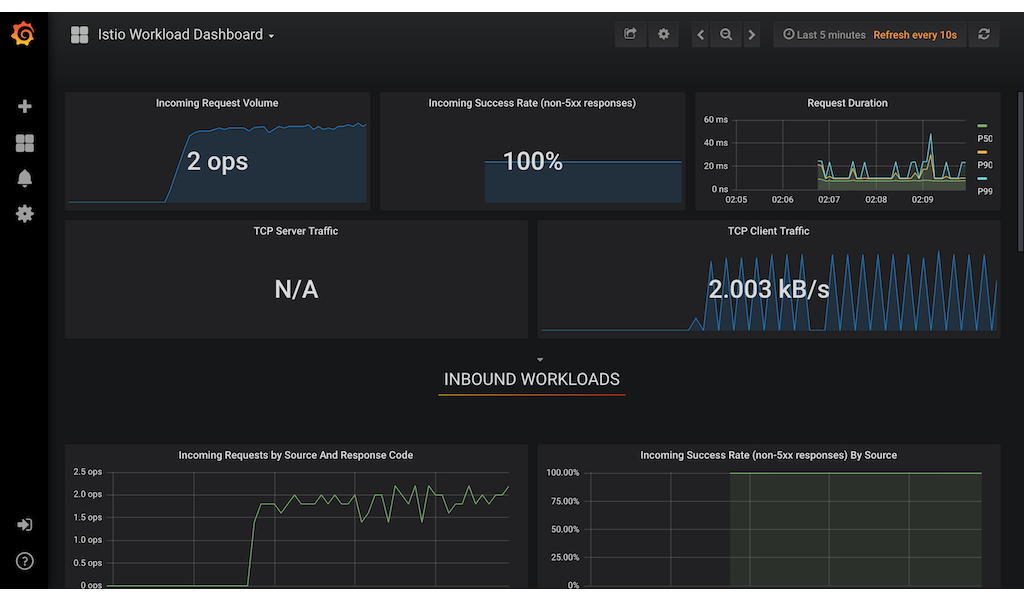
After the installation, a route will be available for us to access the Kiali and grafana. Here is an example of the grafana dashboard.
Deploying the Microservices
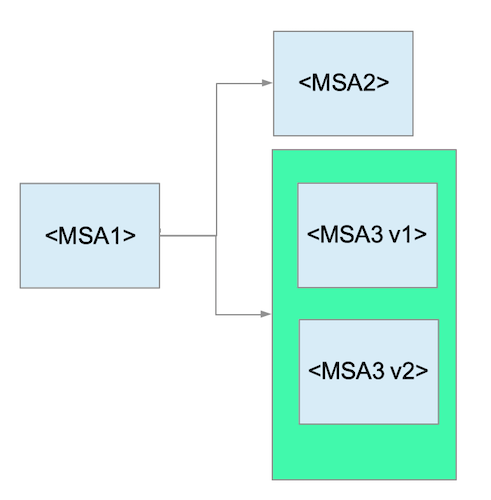
For this demonstration, we will instantiate 3 microservices from the same application which you can find here. https://github.com/corpbob/egress-demo.git. Let’s call them MSA1, MSA2 and MSA3 respectively. MSA1 will call MSA2 and MSA3, combine the results and return them to the caller. The MSA2 will just return “hello from msa2”. The MSA3 will have 2 versions, namely version v1 and version v2. Each version will just return “hello from msa3 version x”, where x is either v1 or v2. A call to MSA3 will be load balanced between the two versions.
Setting up the microservices is easy. We just need to supply an value to an environment variable called FORTUNE_COMMAND which tells it what command to execute. If the FORTUNE_COMMAND is not set, it will execute the fortune command that will return a quotation.
Here’s how our microservices topology look like.
Here are the values of the FORTUNE_COMMAND in our setup:
| Microservice | FORTUNE_COMMAND |
|---|---|
| MSA1 | curl http://msa2:8080/fortune && http://msa3:8080/fortune |
| MSA2 | echo ‘hello from msa2’ |
| MSA3 | echo ‘hello from msa3 version x’, where x is the version of MSA3 that is currently responding. |
Now that we have a basic idea of the demo, here is the github project for you to set it up:
https://github.com/corpbob/istio-telemetry-demo.git
Steps to setup the project
- Create a new project
oc new-project telemetry-demo - Add privileges to the project so that istio would work.
bash add_privilege.sh - Import the template
oc create -f telemetry-demo-template.yml - Create a new application from the template. The template has a paramater
NAMESPACEwhich by default istelemetry-demo. If you want to use another namespace, specify it using the-pswitch:oc new-app telemetry-demo -p NAMESPACE=telemetry-demo - Access the application. Once all pods are up, you can access the application using:
curl http://msa1.telemetry-demo.svc:8080/fortune
The response will be similar to:
hello from msa3 version 2
hello from msa2
You will notice that the msa3 version will be different each time that you invoke the curl command.
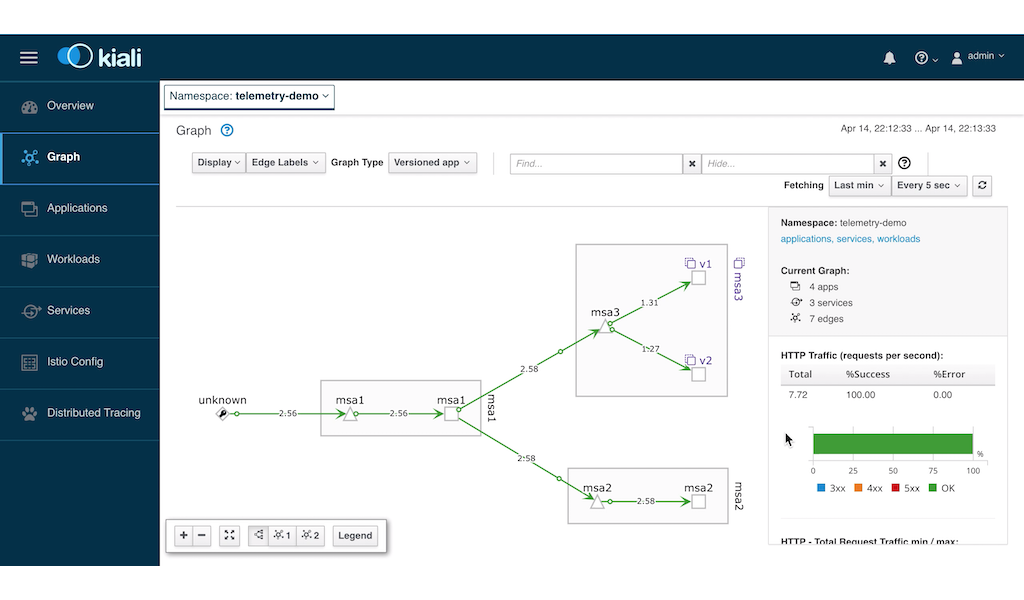
Viewing the Microservice topology using Kiali
Let’s view how the microservices are stiched together using Kiali. However, we need to create some requests so that kiali can determine the flow of the messages. To inject some load, we can use siege:
siege -r 1000000000 -c 1 http://msa1.telemetry-demo.svc:8080/fortune
You can now launch Kiali to view the topology which is similar to this:

Creating a Custom Grafana Dashboard for telemetry demo
We will now create a dashboard that will track the sucessful http response vs the error response. For this demo, we will track response codes 2xx and 5xx. Here is a sample of the dashboard.
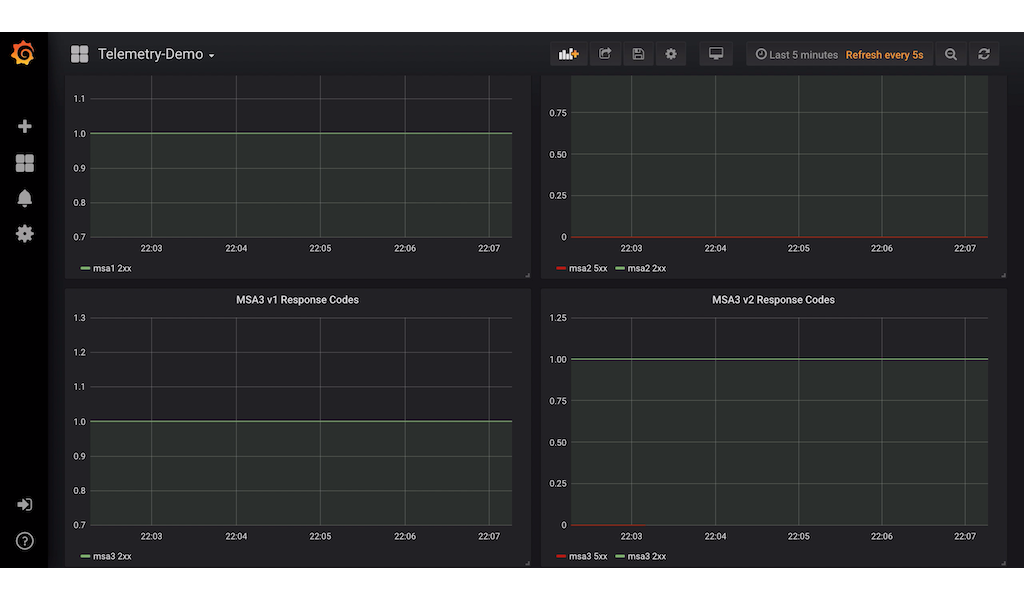
As you can see, we have 4 graphs:
- MSA1
- MSA2
- MSA3 version 1
- MSA3 version 2
In this way, we can see clearly which of the microservices are failing.
Go to the istio-system project and launch the grafana ui. Create a new dashboard ad na new graph. We want to be able to graph the percentage of the 2xx sucessful responses and the 5xx error responses to the overall number of requests. The number of 2xx response codes can be queried in prometheus using the following query:
sum(irate(istio_requests_total{destination_service_name="msa1", response_code=~"5.*"}[5m]))
For more information about Prometheus Query Language, see https://prometheus.io/docs/prometheus/latest/querying/basics/
Looking at the query above, we can see that the query only matches those data that has the property destination_service_name="msa1" and response_code matching the regular expression “5.*”. Also, we only queried for a moving window of 5 minutes.
Since this is going to be a ratio, we need to get the total requests to MSA1 irrespective of the response code. This is queried using:
sum(irate(istio_requests_total{destination_service_name="msa1"}[5m]))
Therefore, the ratio of 5xx to the total requests is:
sum(irate(istio_requests_total{destination_service_name="msa1", response_code=~"5.*"}[5m]))/sum(irate(istio_requests_total{destination_service_name="msa1"}[5m]))
This is what we will put in the query text box of grafana. See screenshot below:
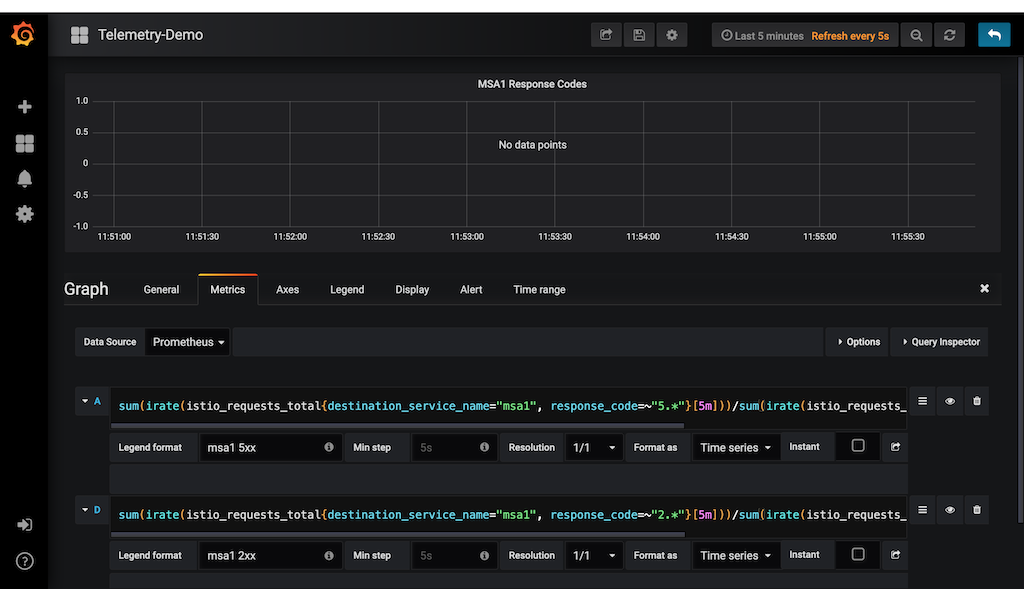
In the same graph, we add another query and compute for the ratio of the 2xx response codes over the total responses. We then set the legend and the title of the graph.
We repeat the same method to create the graph of MSA2, MSA3 v1 and MSA3 v2.
While the siege is injecting traffic into our microservices, the grafana graphs will also update. You can set the update interval to 5 seconds.
Injecting an HTTP fault to Microservice 2
Now let’s simulate an http 500 fault to MSA2 and observe how the grafana is able to see the errors. We will use Istio fault-injection to accomplish this. Open the script fault-injection.sh to see the definition:
cat << EOF | oc create -f -
apiVersion: networking.istio.io/v1alpha3
kind: VirtualService
metadata:
  name: msa2-inject-fault
spec:
  hosts:
  - msa2
  http:
  - route:
    - destination:
        host: msa2
    fault:
      abort:
        percentage:
          value: 50
        httpStatus: 500
EOF
Studying the definition above, you will see that we defined an http abort fault to msa2 service with a value of 50% and response code of 500. Import this definition by executing the script:
bash fault-injection.sh
After a while you will notice in the Kiali dashboard that service MSA1 and MSA2 are having warnings.
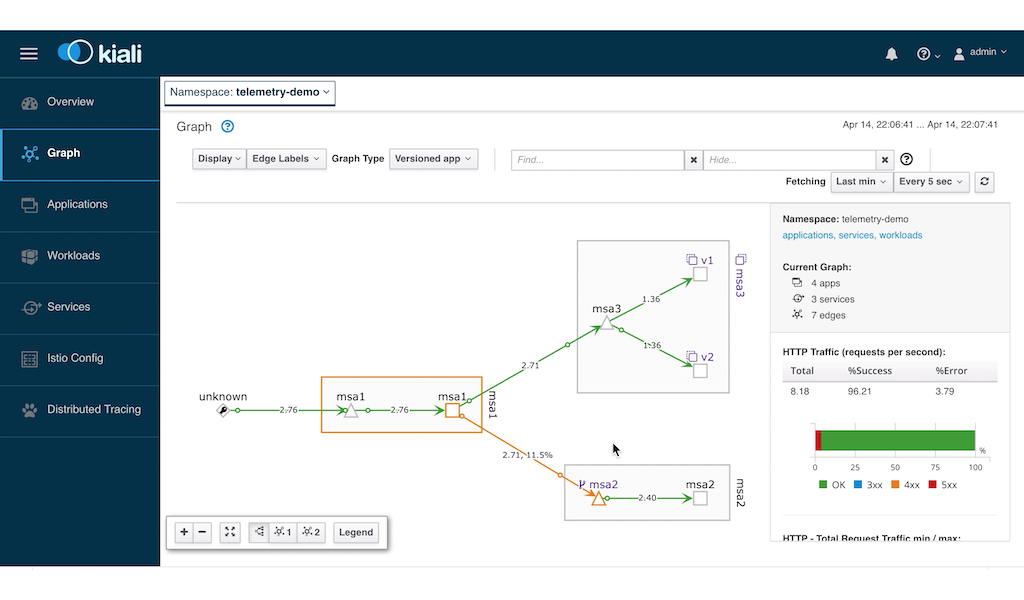
It is not obvious which of the two services are having an error. So we resort to our custom dashboard to see which one.
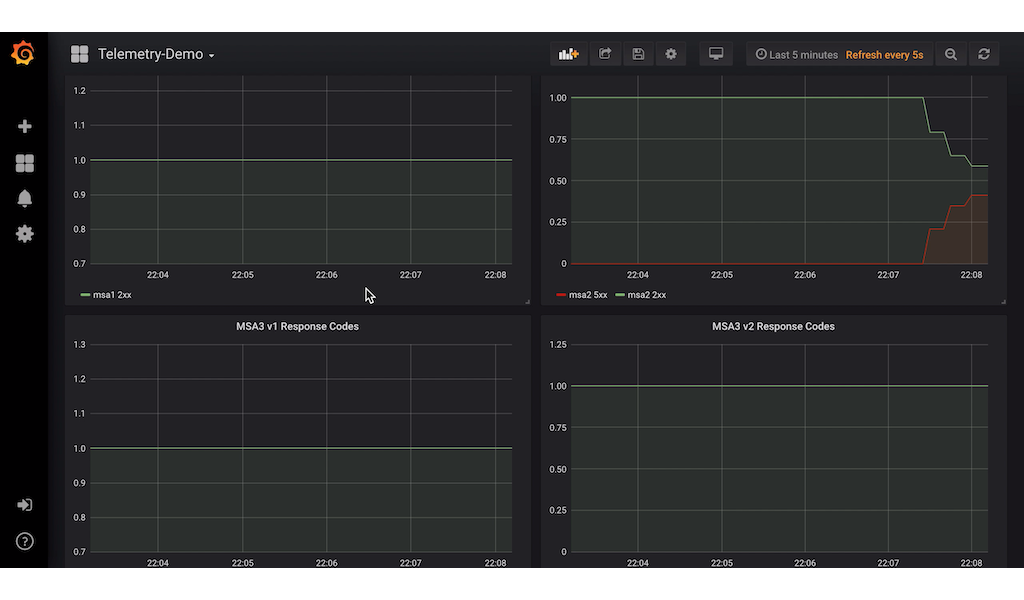
In the screenshot above, we can see that MSA2 service is throwing the errors.
Injecting Errors to MSA3 version
We now enable misbehaviour in MSA3. Open the DeploymentConfig of MSA1 and edit the FORTUNE_COMMAND value from:
curl -v 'http://msa3:8080/fortune' && curl -v 'http://msa2:8080/fortune'
to
curl -v 'http://msa3:8080/fortune?misbehave=true&percent=50' && curl -v 'http://msa2:8080/fortune'
Wait for the pods to redeploy. When the pods are running and the siege command is also running in the background, go to the kiali dashboard and you will see that MSA v2 is now having an error.
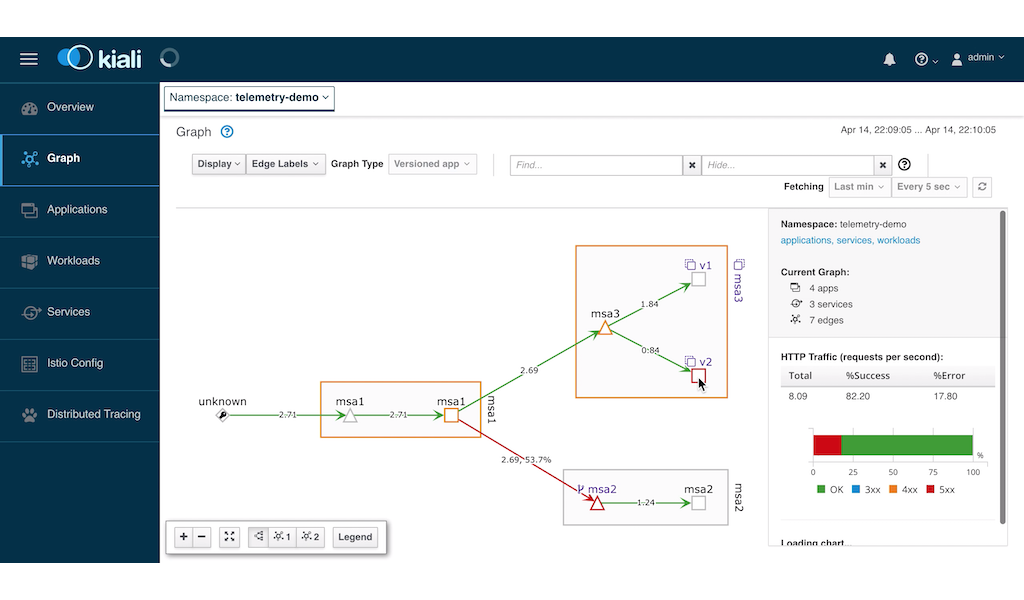
It is quite clear from the above screenshot that version 2 is giving an error. We confirm this by looking at the Grafana screenshot:
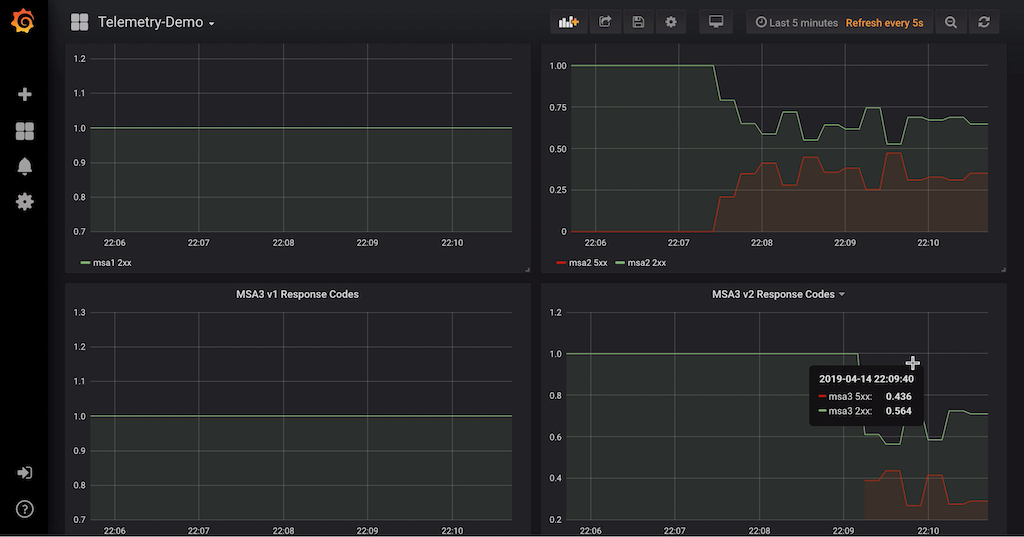
The grafana screenshot shows a red graph caused by the error 500 given by MSA v2 service.
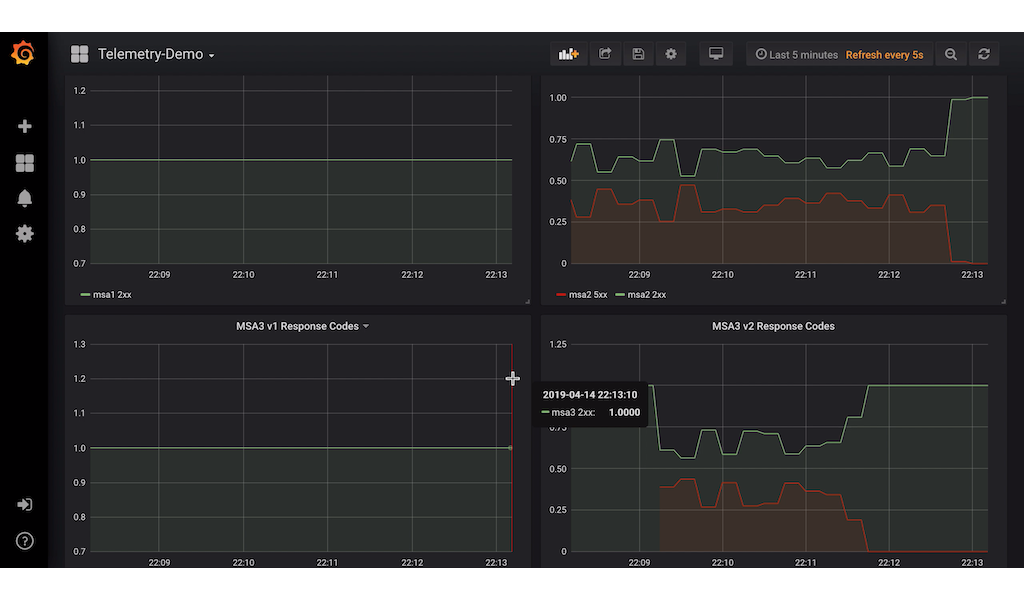
Bringing the Services to Normal
Let’s now remove the misbehaviour of MSA3 v2 by changing the FORTUNE_COMMAND value to
curl -v 'http://msa3:8080/fortune?misbehave=false&percent=50' && curl -v 'http://msa2:8080/fortune'
Also, delete the fault injection for MSA2:
oc delete virtualservice msa2-inject-fault
Looking again at grafana, we see that the error 500 has gone down to zero in both services:
Finally, looking at Kiali, we see that the entire microservice topology is healthy.
Conclusion
Istio indeed helped us identify the problematic microservices in a graphical way using Kiali and Grafana. We hope that you will start to explore the various other ways you can use Istio in your own microservices project.
Written on April 19th, 2019 by Bobby Corpus